

Strategy detail
Open a Databank row to review rules, saved metrics, re-backtest with different costs, then validate, evolve, or export.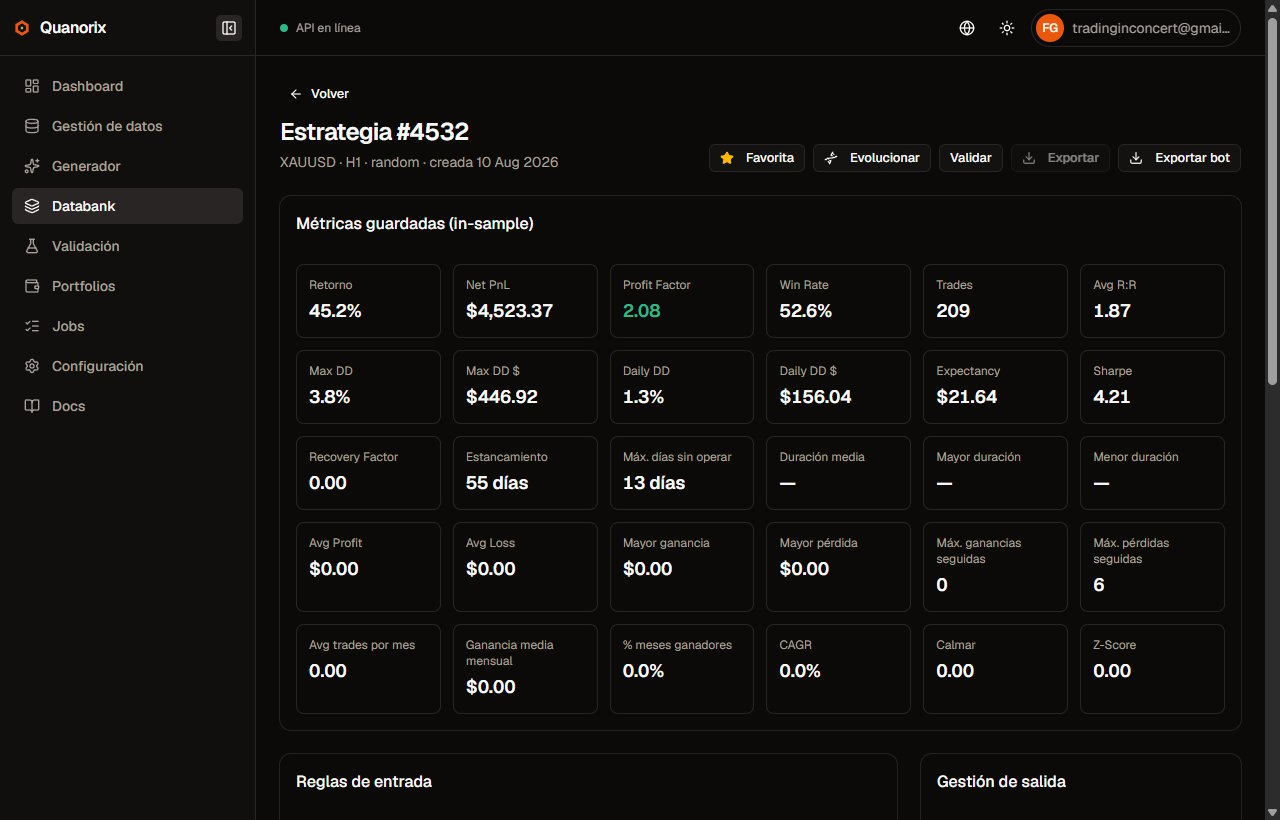
Strategy detail. Click to zoom.
What you see
- Meta: symbol, TF, source, created date.
- IS metrics (and OOS if generation used a holdout) in a five-row grid (see below).
- Entry rules long/short and exit management (ATR stop, R:R, etc.).
Metrics summary
The summary uses the same order on strategy and portfolio detail. Return comes first. Three rows of existing metrics (performance, risk, streaks/time) plus two new rows (per-trade distribution and calendar):
*The UI label is SQN (SQN formula on trades; not an annualized Sharpe of daily returns).
Avg Loss and largest loss are shown with a negative sign. % winning months, CAGR, and Max DD are fractions (the UI formats them as %).
Strategies or backtests from before TPA 1.2.9 may show
0 for the twelve new metrics until you re-backtest (or Save as metrics) with an updated agent. They are not Databank filter columns.
Backtest and equity curve
- Adjust initial capital, risk, spread, commission, session, dates, compounding, and exit/order overrides if needed.
- Click Backtest.
- Review the equity curve, trade summary, and warnings (lot clamped, missing conversion pair, warmup, etc.).
Save as metrics
If you change costs or capital and want the databank’s persisted metrics to match:- Save as metrics → confirm the dialog.
- Quanorix re-backtests and replaces IS metrics (and clears prior OOS if that flow has no OOS fraction).
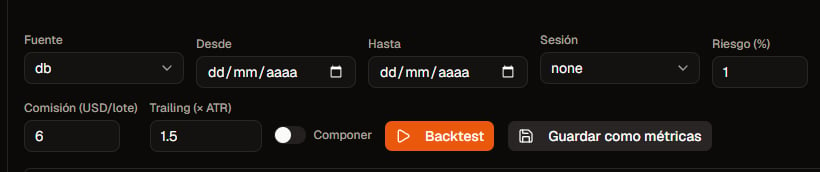
Backtest costs and Save as metrics. Click to zoom.
Monthly analytics
After a backtest you get Monthly analytics (PnL / % by month) and the month×year returns table when data exists — useful seasonality check before adding the strategy to a portfolio.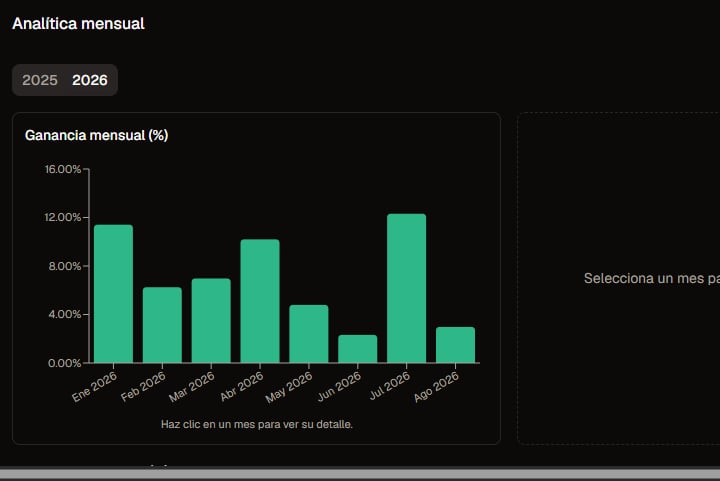
Monthly analytics. Click to zoom.
Evolve (genetics from the parent)
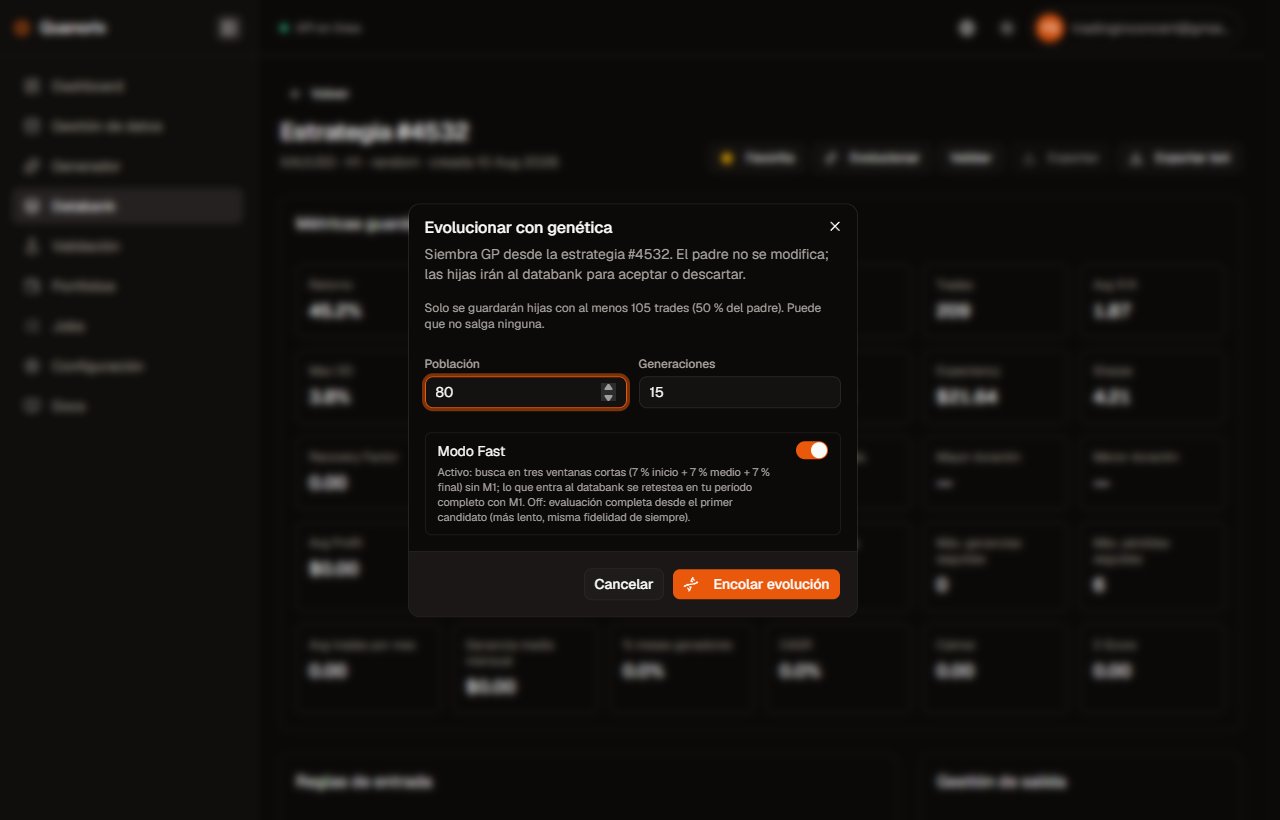
Evolve dialog. Click to zoom.
- Evolve → dialog for GP seeded from this strategy.
- You can toggle Fast mode (inherited from the parent’s generation context; same meaning as in the Generator).
- The parent is not modified; children appear as new strategies (with the parent’s min-trades floor). The job runs on the TPA and can be cancelled from Jobs.
- Then filter Evolved only in the Databank.